29 September 2025
Here’s a sobering fact: 80% of SaaS startups fail because of cash flow problems, not product issues. They build amazing software, get early traction, maybe even land some enterprise clients. And then run out of money because they didn’t understand their unit economics or SaaS startup financial planning.
VCs see this every day. The first thing they scrutinize is actually your financial model and not the product demo or user growth metrics. They want to see if you actually understand how your business makes money, how much it costs to acquire customers, and how long those customers stick around.And it can be overwhelming, especially for first-time founders. That’s why we created an ultimate guide on how to build a SaaS financial model with an actionable plan and pro tips from experienced, serial entrepreneurs.

Core Metrics for a SaaS Financial Model: MRR, ARR, CAC, LTV
Before diving into spreadsheet formulas, let’s nail down the essential SaaS metrics for founders that make or break B2B companies.
1. Monthly Recurring Revenue (MRR) and Annual Recurring Revenue (ARR) form the foundation of everything else. MRR shows your predictable monthly income from all active subscriptions. ARR is simply MRR multiplied by 12, but it’s the metric most B2B investors focus on because it normalizes annual contracts.
Track new MRR from new customers separately from expansion MRR from existing customers upgrading their plans. This breakdown shows whether your growth comes from acquiring new customers or expanding within your current base.
2. Customer Acquisition Cost (CAC) includes every dollar spent getting new customers: sales salaries, marketing campaigns, demo costs, and tools. The trick is calculating fully-loaded CAC that includes all go-to-market expenses, not just advertising spend.
3. Lifetime Value (LTV) predicts total revenue from each customer relationship. The basic formula is:
| Average Revenue Per User (ARPU) × Gross Margin ÷ Churn Rate |
But B2B companies should factor in expansion revenue, making the calculation more nuanced. Understanding CAC and LTV in SaaS models is vital as investors compare them directly. A healthy LTV/CAC ratio signals scalable growth, while a weak one is often a red flag.
4. Churn and expansion rates work together to determine net revenue retention. B2B companies typically see 5–15% annual churn rates, much lower than consumer apps. But expansion revenue from existing customers upgrading or buying additional products can push net revenue retention above 100%.
Regular SaaS churn analysis helps founders spot patterns, like whether specific cohorts churn faster, and adjust pricing, onboarding, or customer success strategies.
5. Payback period measures how long it takes to recoup customer acquisition costs through monthly recurring revenue. Healthy B2B SaaS companies typically see payback periods under 12–18 months.
Here are benchmark ranges to target:
| Metric | Good | Great | Warning Sign |
| LTV: CAC Ratio | 3:1 | 5:1+ | Under 2:1 |
| CAC Payback | 12–18 months | Under 12 months | Over 24 months |
| Annual Churn | 5–15% | Under 10% | Over 20% |
| Net Revenue Retention | 100–110% | 120%+ | Under 90% |
B2B models need additional metrics that consumer apps don’t track. Sales conversion rates at each stage — demo to trial, trial to paid, pilot to full contract — help predict revenue from your current pipeline. Enterprise deals often involve multiple decision makers and approval processes that can stretch over months.
Cohort analysis becomes crucial for understanding customer behavior patterns. Your January 2024 customer cohort might not behave like your June 2024 cohort if you’ve changed pricing, target market, or product features.
One critical pitfall: don’t use retail or consumer metrics for B2B businesses. Metrics like daily active users or session duration matter less than contract value, expansion rates, and customer success indicators.
Not sure how to start your business project?
We’ll help you build a watertight roadmap.
Get a free consultation.
We’ll help you build a watertight roadmap.
Get a free consultation.
How to Build a B2B SaaS Financial Model Step by Step
Building a comprehensive B2B SaaS financial model might seem overwhelming, but breaking it into systematic steps makes the process manageable. Think of it like constructing a house — foundation first, then structure, then finishing touches.
Step 1: Collect Data for Your SaaS Financial Model
Kick things off by collecting all relevant financial data. Think of it as laying the groundwork. Here’s what you need.
- Financial Statements
Export profit and loss, balance sheets, and cash flow statements for the past 12 months. Pre-revenue? Gather spending data and customer research.
- CRM Metrics
Pull sales pipeline stages, conversion rates, and deal sizes from your CRM (e.g., Salesforce, HubSpot).
- Subscription Data
Use your payment processor (e.g., Stripe, PayPal) to track subscription metrics and churn rates.
Don’t stress if your data is messy; startups rarely have pristine records. Create a spreadsheet tab labeled “Historical Data” to organize everything. This tab will be your reference point throughout the process.
A simple template like this one keeps your core SaaS metrics visible and makes trend spotting easier:
| Month / Quarter | New Customers | Churned Customers | Active Customers | MRR ($) | CAC ($) | LTV ($) | Churn Rate (%) | Notes |
|---|---|---|---|---|---|---|---|---|
| Jan 2024 | 120 | 15 | 480 | 48,000 | 1,200 | 15,500 | 3.1% | Seasonal spike |
| Feb 2024 | 100 | 12 | 568 | 52,500 | 1,180 | 15,700 | 2.6% | — |
| Mar 2024 | 140 | 20 | 688 | 63,200 | 1,250 | 16,100 | 2.9% | Promo campaign |
| … | … | … | … | … | … | … | … | … |
Step 2: Set Realistic Assumptions for Your SaaS Financial Model
This is where most founders slip — modeling what they hope to achieve instead of what’s actually happening.
- Growth: Sustainable B2B SaaS growth is 10–20% monthly. If you’re at 5%, don’t model 30% without a clear strategy shift.
- Churn: Early-stage companies often face 10–20% annual churn, improving to 5–10% as they mature. New customers may churn faster than established ones.
- Sales cycles: If deals take 4–6 months to close, bake that lag into your revenue forecast. Cash follows your actual sales timeline.
Use historical performance to inform these numbers. At Rocketech, we’ve seen startups thrive by staying conservative yet optimistic.
Step 3: Forecast SaaS Revenue with B2B Precision
Model three things: new customer acquisition, expansion from existing customers, and churn/contraction.
Use this formula:
| Next Month’s MRR = Current MRR + New Customer MRR + Expansion MRR – Churned MRR – Contraction MRR |
Here’s how to approach it.
- Baseline: Start with your current Monthly Recurring Revenue (MRR).
- New Customers: Estimate new MRR based on your sales pipeline and conversion rates.
- Expansion: Factor in MRR from existing customers upgrading plans or adding users.
- Churn/Contraction: Subtract MRR lost from cancellations or downgrades.
Account for seasonality: enterprise buying often slows in Q4 and ramps up in Q1. If you serve multiple segments (e.g., SMBs vs. enterprises), model them separately, as their churn and expansion patterns differ.
Many founders also use a SaaS revenue forecast template in Excel or Google Sheets to standardize assumptions and make projections easier to share with investors.
Step 4: Model Expenses with Growth-Driven Logic
B2B SaaS costs follow predictable patterns tied to growth drivers. Knowing these helps with forecasting and hiring.
- Sales & Marketing: Often 40–60% of revenue during growth. Plan hiring with realistic ramp times; enterprise reps usually need 6–9 months to become fully productive.
- R&D: Covers engineering, cloud, and tools. Once product-market fit is reached, it stabilizes at 15–25% of revenue.
- Customer Success & Support: Scales with customer volume and complexity, not revenue. Enterprise clients need dedicated managers; smaller ones can use scalable systems.
- G&A: Includes legal, accounting, insurance, and office costs. Grows slower than revenue and shrinks as a percentage over time.
- Equity Compensation: Employee and advisor equity don’t affect cash flow upfront, but they are real costs investors consider in valuations.
| Expense Category | Typical % of Revenue | Scaling Driver |
| Sales & Marketing | 40–60% (high-growth) | Sales team ramp-up(6–9 months for enterprise reps) |
| R&D | 15–25% (post-PMF) | Engineering salaries, cloud costs |
| Customer Success | Varies | Customer count and complexity |
| General & Admin | Decreases as you scale | Legal, accounting, office costs |
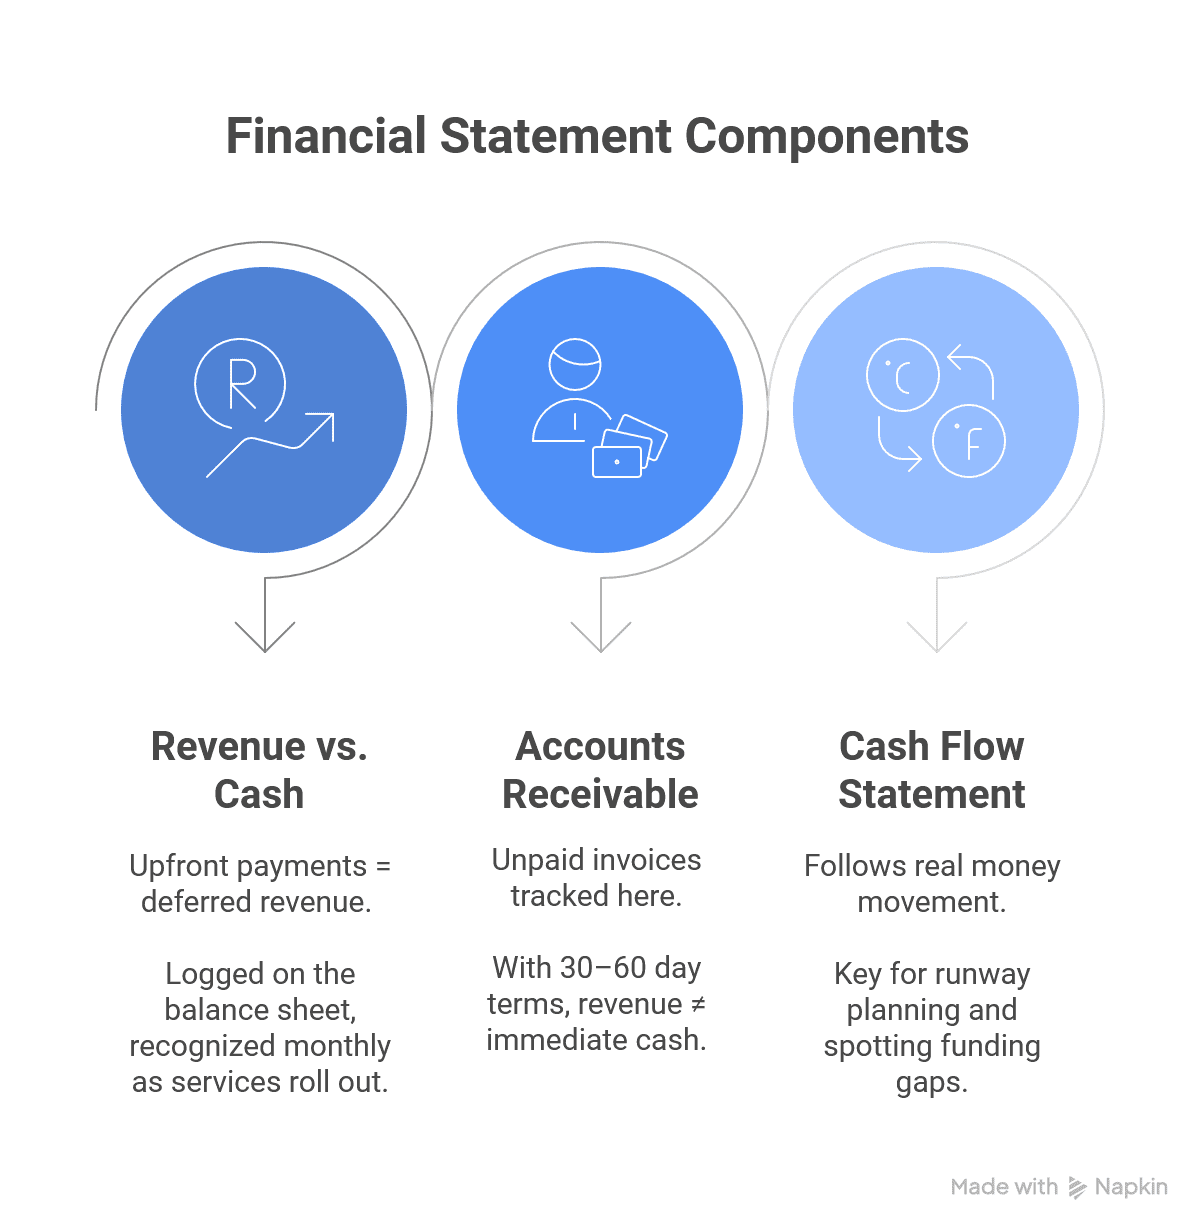
Step 5: Link SaaS Financial Statements (P&L, Balance Sheet, Cash Flow)
Financial modeling only works when your income statement, balance sheet, and cash flow are properly linked. This ensures accuracy and reflects real cash timing.
- Revenue vs. Cash
Annual contracts paid upfront create deferred revenue. They are booked on the balance sheet and recognized monthly as services are delivered.
- Accounts Receivable
Tracks unpaid invoices. With 30–60 day terms, revenue and cash collection often don’t align.
- Cash Flow Statement
Shows actual money movement. Crucial for calculating runway and spotting funding gaps.
Step 6: Visualize Your SaaS Financial Model Dashboard and Metrics
A great model is a tool for decision-making. Create a dashboard tab to visualize key metrics:
- Charts: Show MRR growth, customer acquisition trends, and key ratios (e.g., CAC payback period).
- Actuals vs. Budget: Compare projections to reality for accountability.
- Alerts: Set thresholds for critical metrics, like runway dropping below 12 months.
Keep it clean and shareable. Use clear labels and logical tab organization so your team and investors can easily navigate.
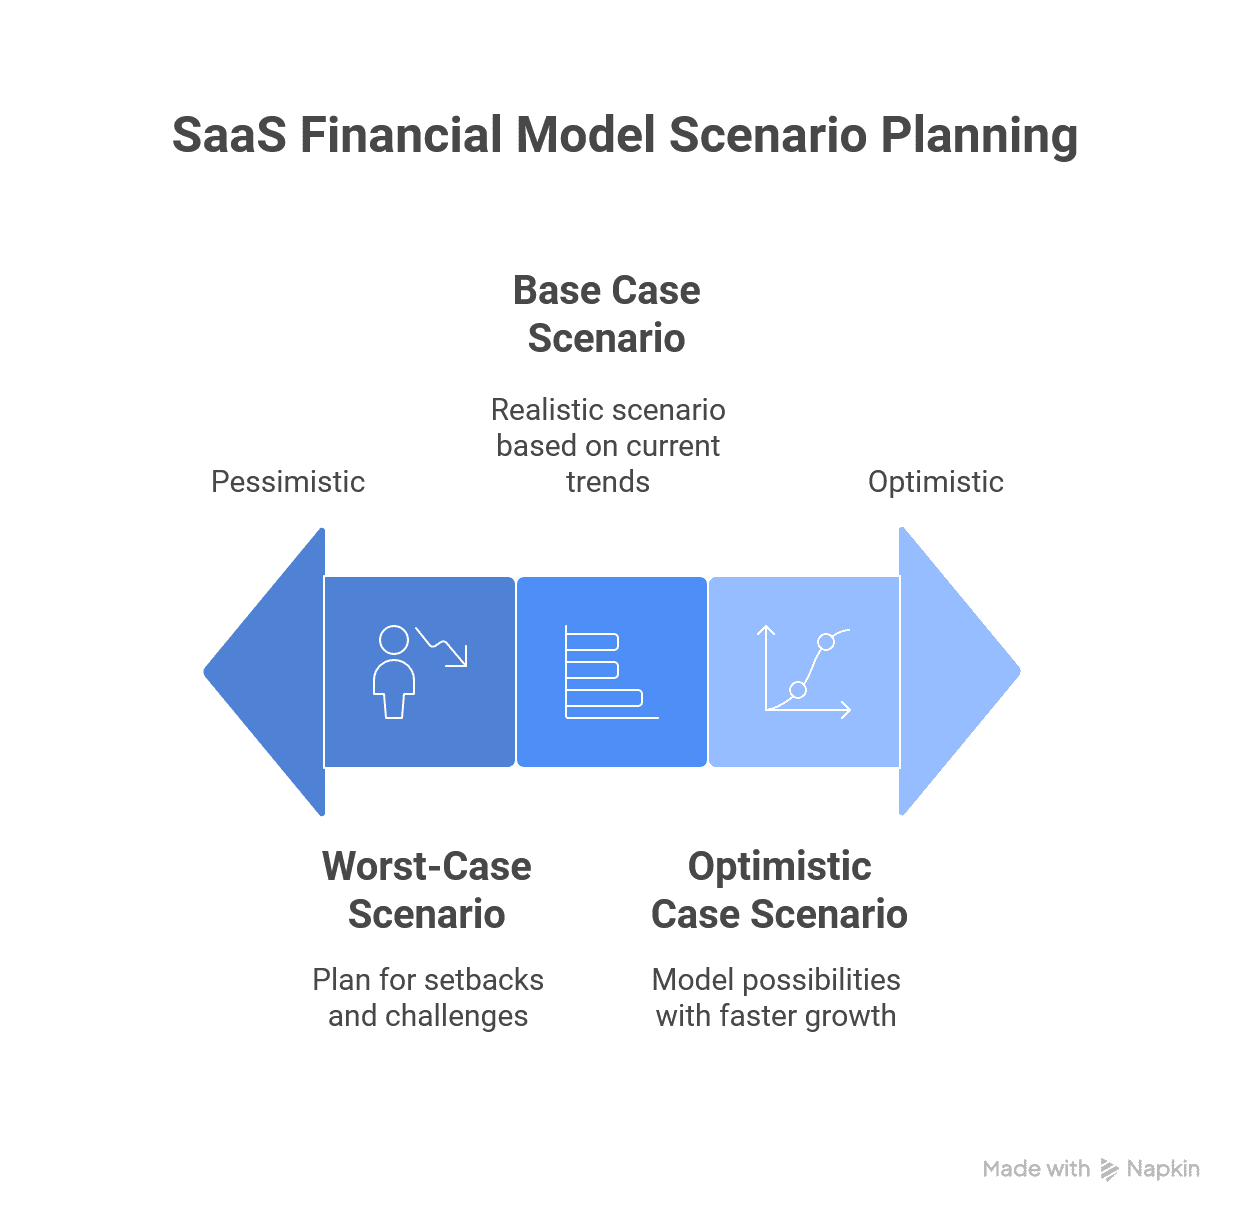
SaaS Financial Model Scenario Planning: Base, Optimistic, and Worst Case
Smart SaaS founders know that plans rarely unfold perfectly. Instead of trying to predict the future, they model multiple scenarios to understand how key variables impact their business and to prepare accordingly.
Base Case Scenario
This is your most realistic scenario, based on current trends and reasonable assumptions. It becomes your main operating plan, the one you’re accountable for.
Aim for ambitious but achievable targets, grounded in actual performance data.
Optimistic Case Scenario
This models what’s possible if things go better than expected: faster sales cycles, lower churn, successful market expansion, or viral growth.
Adjust assumptions upward, e.g., 25% faster growth, 20% lower churn, or 30% higher expansion rates.
Worst-Case Scenario
Plan for setbacks like economic downturns, rising competition, or internal execution issues. Expect longer sales cycles, higher churn, and increased acquisition costs.
For B2B companies, this might include budget freezes or slower decision-making.
How to Model B2B SaaS Financial Future
Use toggle switches in your spreadsheet — dropdowns or checkboxes — to shift between scenarios. For B2B SaaS, stress-test sales cycle length: uncertainty can stretch buying decisions from 3 months to 6–9. Model how this impacts cash flow and hiring.
A simple SaaS runway calculation or runway calculator can show how many months you have until breakeven in each scenario. If your worst-case scenario shows only 8 months of runway, you’ll need to fundraise now or cut costs to buy time.
Why It Matters
Share these models with your team and board. They clarify which variables matter most and help align contingency plans. Investors appreciate scenario planning — it signals strategic thinking and strong risk management.
Common SaaS Financial Modeling Mistakes to Avoid
Even seasoned entrepreneurs stumble when building their first financial model. Avoiding common mistakes can save you time, money, and credibility.
- Over-optimism kills trust. Investors see “hockey stick” projections daily and immediately discount them. Build realistic forecasts that account for setbacks and slower growth.
- Manual errors snowball. Use formulas instead of hard-coded numbers. Add error checks to catch issues like negative churn or customer counts that exceed your total market.
- Outdated models lose value fast. Update monthly. Refresh actuals and assumptions regularly. A static model becomes irrelevant within weeks.
- Ignoring cash timing is risky. Revenue recognition might show profits while your bank balance shrinks. Model actual cash inflows and outflows, especially for annual contracts and long payment terms.
Expert SaaS Financial Modeling Tips for Founders
Based on years in custom software development, we’ve collected pro tips that separate sophisticated founders from spreadsheet amateurs.
1. Outsource early if needed.
A fractional CFO or expert consultant can save weeks of frustration and prevent costly mistakes. It’s an investment in better decisions and investor confidence.
2. Automate with tools like Baremetrics, ChartMogul, or Orb.
Connect subscription data directly to your model to reduce manual errors and keep projections current.
3. Align your team.
Share monthly updates with department leads. Show how their work impacts financial performance. This builds accountability and clarity.
4. Model upsell paths.
Enterprise customers often start small and expand. Capturing this in your model improves LTV estimates and strategic planning.
5. Account for seasonality.
Enterprise sales are affected by budget cycles, holidays, and industry timing. Bake these patterns into your forecasts.
6. Validate constantly.
Compare projections to actuals. When they diverge, dig into the “why” and adjust. The goal is not to reach perfection (it’s impossible) but to make smarter decisions over time.

Key Takeaways: SaaS Financial Modeling Best Practices for Startups
Your SaaS investor-ready model is your startup’s GPS: it guides decisions, attracts investors, and helps you navigate challenges. Success often hinges on how well founders understand unit economics and model realistic growth.
Start simple, then refine with real data. No model is perfect, but a well-maintained one is a powerful decision-making tool. Update quarterly, share with your team, and use it to inform hiring, fundraising, and strategy.
Even the best model is only as strong as its assumptions. Focus on real customer data, test your hypotheses, and build a business that delivers genuine value. The spreadsheet is just the tool, while your fundamentals drive success.
Not sure if you created the correct B2B SaaS financial model?
We’ll audit it based on years of experience.
We’ll audit it based on years of experience.
FAQ: B2B SaaS Financial Models
What is a SaaS financial model?
A SaaS financial model is a spreadsheet or tool that projects how a subscription business makes and spends money. It typically includes:
- Revenue (MRR, ARR, expansion, churn)
- Expenses (sales, marketing, R&D, support)
- Cash flow and runway
Founders use it to plan growth, manage cash, and show investors realistic unit economics.
What metrics should SaaS founders track in a financial model?
The must-have SaaS metrics include:
- MRR / ARR: recurring revenue streams.
- CAC: cost to acquire one customer.
- LTV: total value per customer.
- Churn rate: % of customers leaving.
- Net Revenue Retention (NRR): revenue growth from existing customers.
- CAC Payback Period: time to recover acquisition cost.
These numbers show if growth is sustainable and investor-ready.
How do you calculate SaaS runway?
Runway shows how many months your startup can operate before running out of cash.
Formula:
Runway = Current Cash ÷ Monthly Net Burn
- Current Cash = money available today
- Monthly Net Burn = average monthly expenses – revenue
Example: $600K cash ÷ $100K burn = 6 months runway.
How do investors evaluate a SaaS financial model?
Investors look for:
- Realistic assumptions (no “hockey stick” curves)
- Unit economics (LTV/CAC ratio, CAC payback, churn)
- Scenario planning (base, optimistic, worst case)
- Cash timing (accounts receivable, deferred revenue)
Strong models balance growth with sustainability. Clear assumptions and regular updates build investor trust.
How do you forecast SaaS revenue?
Forecasting SaaS revenue requires tracking changes in Monthly Recurring Revenue (MRR).
Formula:
Next Month’s MRR = Current MRR + New MRR + Expansion MRR – Churned MRR – Contraction MRR
- New MRR: revenue from new customers
- Expansion MRR: upgrades or add-ons
- Churned/Contraction MRR: losses from cancellations or downgrades
Pro tip: Model three scenarios (base, optimistic, worst case) to understand risks and cash flow needs.