18 September 2025
You’ve built an amazing product. Your beta users love it. Early customers are signing up. But then comes the question every founder dreads: “Show me the numbers.” It means you need a B2B SaaS financial model.
But most founders approach this backward. They jump straight into building complex spreadsheets without understanding what they’re actually modeling. They focus on impressing investors instead of making better decisions.
In this guide, we show what a financial model actually is, why B2B SaaS models are unique, and what SaaS financial metrics founders must track — the essential knowledge you need before you build anything.

What Is a B2B SaaS Financial Model?
At its core, a B2B SaaS financial model is a roadmap in numbers. It takes your business plan and translates it into forecasts. Unlike a simple budget that tracks what you spend, a financial model connects all the dots between customer acquisition, revenue growth, operational costs, and cash flow.
Think of it as your business GPS. It shows where you are now, where you’re heading, and helps you make course corrections along the way.
Why B2B and B2C SaaS Models Are Different
It’s important to remember that B2B SaaS models differ big time from B2C approaches.
- In B2C, you might be running high-volume, low-ticket products with fast viral growth.
- In B2B, you’re facing longer sales cycles, multi-stakeholder approvals, and often complex pricing structures.
That difference changes the math completely. Ten enterprise clients paying $5,000 a month is not the same as 10,000 users paying $5 each.
- Enterprises might take six months to close; it requires dedicated sales teams.
- In the B2C world, churn is fast, acquisition is expensive, but consumer apps thrive on instant, self-service signups.
If you’re building a SaaS startup financial model, make sure your assumptions reflect that B2B reality. Otherwise, you’ll end up forecasting growth that never materializes.
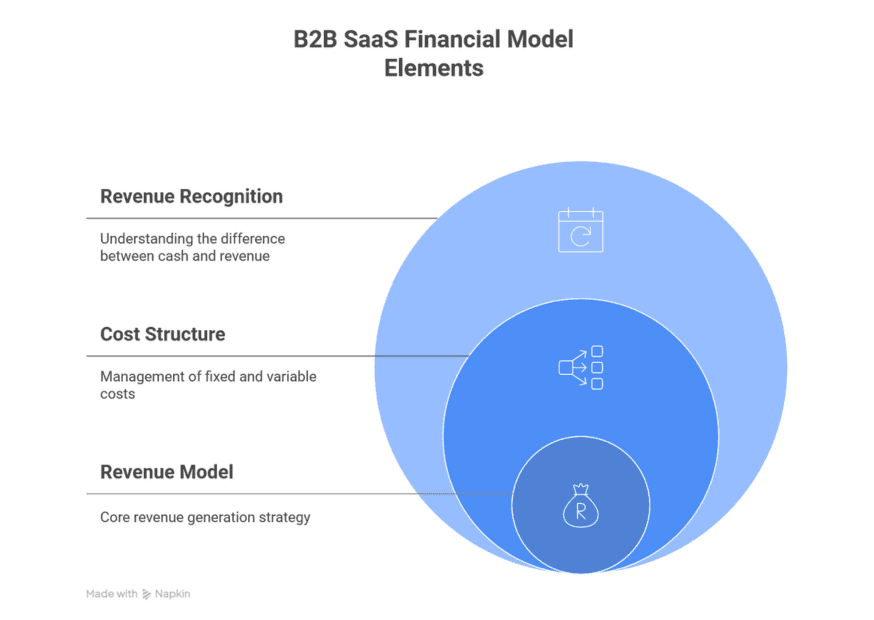
Key Elements of Your SaaS Financial Model
Creating a clear SaaS financial model means understanding the key components that show how your business works. Let’s break down the core elements.
Revenue Model Structure
Your revenue model is the core of your business. Most B2B SaaS companies use subscriptions, but the details vary. Some charge a flat monthly or yearly fee, others base it on usage (like transactions or data), and many mix both.
For example, a project management tool might cost $50 per user each month, while a payment platform could charge a $200 base fee plus extra for each transaction. Your choice impacts how predictable your revenue is, how much it costs to get customers, and how your business grows.
The three main SaaS subscription types:
- Seat-based: Flat fee per user (most common)
- Usage-based: Pay for what you use (API calls, data, transactions)
- Hybrid: Base fee plus usage charges
Understanding Costs: Fixed vs. Variable
Mastering your cost structure is key to predicting profits and scaling smart. Knowing how to model fixed and variable costs in SaaS financial models helps founders optimize margins and avoid cash-flow surprises.
Let’s break it down into two clear buckets to keep your planning sharp.
Fixed costs stay the same, like:
- Core team salaries
- Office rent and utilities
- Basic tech infrastructure
- Insurance and legal fees
Variable costs change with more customers, like:
- Extra cloud hosting and infrastructure
- Customer support staff
- Payment processing fees
- Additional sales team members
B2B SaaS companies often save money because adding new customers doesn’t cost much extra. But things like sales and customer support can add variable costs, so plan carefully.
The Revenue Recognition Reality
Here’s where many founders get tripped up. If a customer pays $12,000 upfront for a year, you don’t book all that revenue in month one.
- Cash comes in when they pay.
- Revenue gets recognized monthly ($1,000 per month).
- Your model needs to track both.
This timing difference affects your cash flow and how you report growth to investors.
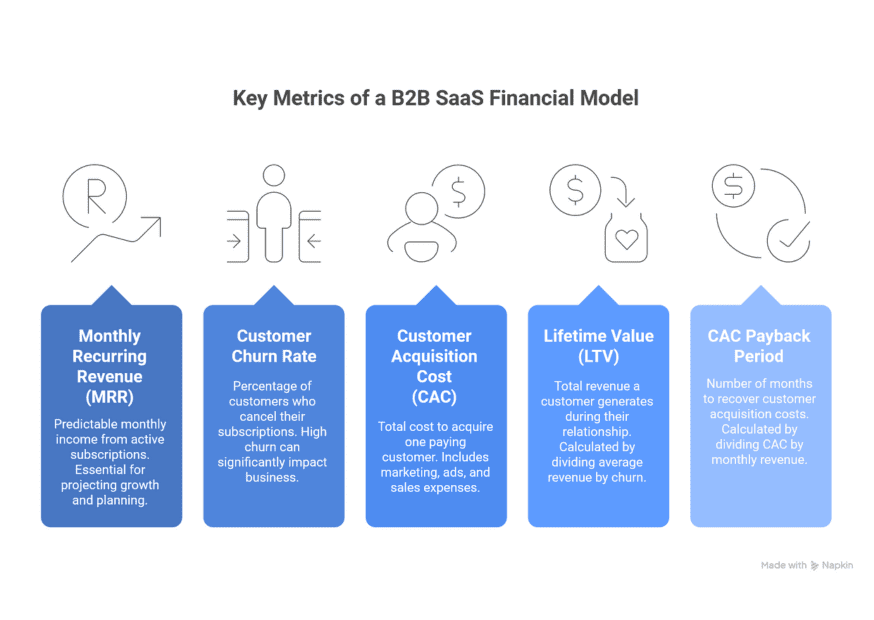
Financial Metrics Every B2B SaaS Founder Must Track
You don’t need to track every number — focus on a core set of key performance indicators to keep your model simple and useful. We listed key metrics to include in a B2B SaaS financial model.
1. Monthly Recurring Revenue (MRR)
Monthly Recurring Revenue (MRR) is the heartbeat of your SaaS business. It’s the predictable monthly income from all active subscriptions, even if some are paid annually.
Knowing how to forecast MRR in B2B SaaS financial models is essential for projecting growth, securing investor confidence, and planning your next strategic move. MRR reveals how your business is scaling and sets the foundation for reliable revenue predictions.
To get a clear picture, track these key MRR components separately:
- New MRR: Revenue from brand new customers
- Expansion MRR: Extra revenue when existing customers upgrade
- Churned MRR: Revenue lost when customers cancel
- Net New MRR: New + Expansion – Churned
Pro tip: Convert annual contracts to monthly amounts for consistency. A $12,000 annual contract = $1,000 MRR.
2. Customer Churn Rate
Churn rate is the percentage of customers who cancel. This metric can make or break your SaaS business.
Monthly churn looks at cancellations each month, while annual churn tracks them over a year. Annual churn is often clearer for B2B companies with long-term customers.
Two types to track:
- Logo churn: Percentage of customers lost
- Revenue churn: Percentage of revenue lost
SaaS churn rate calculation is both simple in concept and difficult in practice. You might lose 5% of customers but only 2% of revenue if smaller accounts leave. Most B2B SaaS companies have yearly churn rates of 5% to 15%, depending on customer type and contract length.
3. Customer Acquisition Cost (CAC)
CAC is what you spend to land one paying customer, including things like marketing, ads, and sales team expenses.
What to include:
- Marketing spend (ads, content, events)
- Sales team salaries and commissions
- Marketing tools and software
- Lead generation costs
Simple formula: Total acquisition costs ÷ New customers acquired
Make sure you match the time periods. If you spent $50,000 on marketing in January and got 10 new customers, your CAC is $5,000.
Feeling overwhelmed? We helped 100+ startups go through launch. Get a free consultation.
4. Lifetime Value (LTV)
LTV is the total revenue a customer brings in over their relationship with you. For a basic calculation, divide average customer revenue by churn rate.
Example: If customers pay $500/month and you have 5% annual churn: LTV = $500 × 12 months ÷ 0.05 = $120,000
5. SaaS CAC vs LTV Golden Ratio Explained for B2B
This ratio shows if your spending to get customers is worth it. A healthy B2B SaaS company usually has an LTV that’s at least three times higher than CAC.
- Good: $15,000 LTV with $5,000 CAC (3:1 ratio)
- Problem: $8,000 LTV with $12,000 CAC (less than 1:1)
For example, spending $5,000 to get a customer who brings in $20,000 is good. If it’s the other way around, that’s a problem.
6. CAC Payback Period
How many months it takes to recover your acquisition costs. Calculate it by dividing CAC by monthly revenue per customer.
Formula: CAC ÷ Monthly revenue per customer
Target: Under 12 months for healthy B2B SaaS
Example: $6,000 CAC ÷ $500 monthly revenue = 12 months payback
Common Beginner Mistakes (And How to Avoid Them)
First-time SaaS founders often make errors in their financial models that can hurt decision-making and credibility. Here are the common mistakes in B2B SaaS financial modeling and how to avoid them.
Mistake #1: Overestimating Revenue Growth
It’s easy to dream of 20% monthly growth to meet big goals, but realistic B2B SaaS growth is usually 5–15% per month.
Real Example
One startup pitched 20% monthly growth for their Series A but only hit 5%, with high churn, leading to layoffs and funding trouble.
The Fix
Base growth projections on your actual data, not aspirational targets. Look at your current growth rate and be realistic about scaling challenges.
Mistake #2: Ignoring Churn in Long-term Projections
Many founders focus on adding customers but forget to account for those who leave. This makes long-term projections unrealistic, showing way more customers than you’d actually have by, say, month 36.
The Problem
Your model adds 100 customers per month but ignores the 10% churn rate. By month 12, you think you have 1,200 customers, but you really have about 550.
The Fix
Model churn from day one and track it religiously. Even 5% monthly churn dramatically changes your long-term numbers.
Mistake #3: Misjudging Sales Timing
B2B sales can take 3–6 months, so marketing costs hit now, but revenue comes later. This delay can cause cash flow issues, even if your business is solid.
The Reality
You spend $10,000 on marketing in January, generate leads in February, close deals in April, and get paid in May. That’s a 4-month delay between spend and cash.
The Fix
Model your sales pipeline with realistic timing. Map out each stage and how long it typically takes.
Mistake #4: Building Only One Scenario
Some founders make a single plan, assuming everything goes perfectly. But businesses rarely go exactly as planned.
The Problem
You model best-case growth and then reality hits. You’re not prepared for slower growth or higher churn.
The Fix
Start with at least two scenarios:
- Base case: What you realistically expect to happen.
- Worst case: Conservative assumptions for tough times.

Key Takeaways
The key insights to remember:
- B2B is different from B2C: Longer cycles, higher values, and complex sales processes.
- Focus on the core metrics: MRR, churn, CAC, LTV, and payback period tell the real story.
- Avoid the rookie mistakes: Overestimating growth, ignoring churn, and misjudging timing.
Most importantly, your financial model is a tool for making decisions, not impressing people. The best models help you run your business better and make smart choices about where to invest your time and money. Using financial models to predict SaaS growth and churn becomes your competitive advantage — you’ll spot problems before they hit and opportunities before your competitors do.
Still have questions about B2B SaaS financial models?
Talk to our experts for free.
Talk to our experts for free.